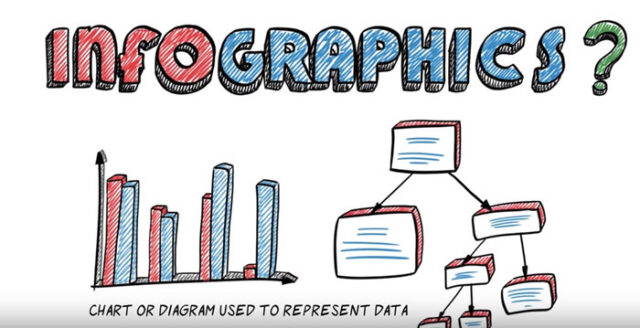
Information graphic, better known as infographic is a visual representation of complex data and information displayed in a simple, memorable, fast and scenic way. Most importantly, it plays a key role in the visual world of marketing. Today infographics are used in the media, scientific papers, articles, education, road signs, manuals and charts. Computer scientists, mathematicians and scientists use infographics to develop symbols with which they can communicate. Infographics displays the information that is hard to explain in words and use visual signs that mark everyday terms like image bus that indicates the bus station.
Did you know that adding photos to the Facebook post generate 65% more interactions with your fans?
To create excellent infographic it is necessary to follow a few important guidelines:
1. Visual display of numbers
Do you want to present a weekly report of work or a new business idea to investors? In any event, the best effect is achieved when the facts and figures are displayed with the help of infographics. Explore which images and graphics can be used to display these elements. If your survey or report contains some very high or significant fact, this is an ideal opportunity to highlight it with the help of visualizations.
2. Set the numbers inside the shapes
Shapes help keep the focus on the content. The heart of any good infographic are figures and statistics – highlight them! You can choose between hundreds of different types, you can easily change the color and size of each shape in order to adjust the design.
3. Highlight the key information with colors
Colors can help to increase the effect of infographics. Use bright, cheerful colors that increase the chances that the information will be noted.
4. Create mind maps with lines
As with shapes, you can also create infographics with illustrations and icons, and with the help of mental maps, you can display information. Use simple lines that do not distract from other elements.
5. Create visual tags using consistent elements
By using visual tags you allowing the user to easier connect all information. It’s a great way to share complex information into smaller pieces and label them in order to make them easy to read. Given the fact that the tags are associated, you should use consistent elements. For example, use only letters or numbers in the circles of the same color.
Now when you know how to create an infographic it’s time for promotion of your website. If you want to know How To Promote Website By Using Infographic, check out the video infographic below:


