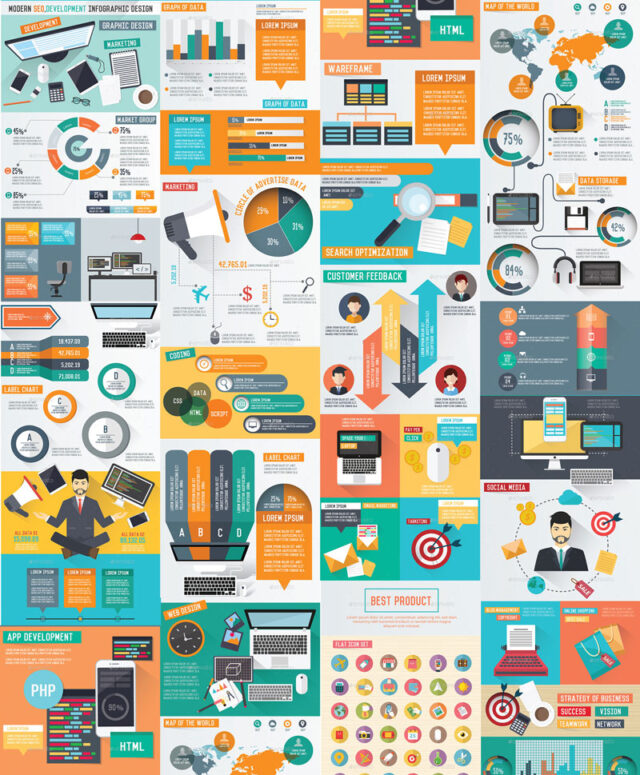
Do you like the various infographics, which you can find on the Internet? Many different infographics you could have found on our blog. Thinking of creating your own infographic but do not know how to do it and how much will it really be helpful for your readers?
First of all, for the infographic you need to have an idea, which will be simple and concise, without too much content that could bit tiring for your readers. Will you succeed with your infographic to answer some questions? When you define what you want your infographic contain, you can start thinking about how to do it.
What can you “tell” by Infographic
Infographics may be used:
- When introducing new products or when comparing with similar products
- For a comparative analysis of data and statistics
- To illustrate the guidelines for the usage of products / services
- In the modern form of Press Releases
…
How to make the infographic in 5 steps
1. Answer the question, what I want to achieve?
First of all, as well as in the use of any other tools, ask yourself what you want to achieve. Is that something you explain, promote, to remind people of the important distinctive point of your brand / services, to contribute to resolving the crisis, to illustrate the growth of your company, the effect of its management, political program …
The result of this first phase would have to be defined objective of infographic in one sentence!
2. Analysis, research and data collection
When you know what you want to achieve, begin with data retrieval, analysis and information that will be of use. It is a process of analysis and research. As part of this process it is important that you:
- are analytical type of person
- are inclined to lateral / creative thinking
- know a lot about the topic, or know where you can find what you don’t know
- it is necessary to distinguish the important from the unimportant!
The result of the second phase would have to be thick drawer / folder with links, documents, analyzes, descriptions, etc. which are related to the topic of infographic, and in relation to its objectives!
3. Deduction
In the third phase you switch the brain in 6th gear! And both hemispheres. You must combine data and information with creative and inspiring elements of your spirit and from the general conclusions you should reach the individual, significant and comparable conclusions, all in order to achieve the goal of infographic!
The result of the third phase is the mapping of the most important group of information, three or four groups of data that you already have slowly visually placed on a sheet of paper: the sheet of paper in your head, in Word or on the real paper.
4. Data Visualization
Here, you devising visual structure of infographic. Where and in what form you will set up its data which is selected through a phase of deduction. Will the data be illustrated by pie charts, funnel, the star; whether the main illustration contain data or you will detach it from the central illustration; what best illustrates different data.
Result of the fourth stage is a clear concept of the structure and partly clear vision of the expected design.
5. Infographic design
Now you have all the answers you can start creating visually part of infographic. If you don’t have idea for design, you can find inspiration on internet, or use some really cool tools for creating infographics. The result of the last, fifth stage, is a clear, interesting and visually appealing, not to mention beautiful, infographics that people will just want to share with their friends!
General advice about infographics
- They must have clear business and promotional objectives
- They must be transparent and simple
- They must be interesting
- They must be easily “sharable”
Do not forget – to make a good infographic is far from an easy job! Infographics are the essence of your intellectual and creative potential on some topic. More tips about how to make a good infographic, you can read here.
Below you can check great infographic templates for download:
Marketing SEO Infographic design
This is great infographic template for every marketing business, it’s modern, clean, colorful and very interesting. It’s easy editable, you just need to arrange data and you’re done! Preview and download here.
Infographic Brochure Elements Bundle
Huge pack of infographic vector elements to create your own brochures. All sets contains lots of different elements and now as a bundle you’ll get great amount of creative vector elements. Actually these elements are ment to be used in more than just infographics. Projects where you might want to use these templates are endless: • freelance projects • newspapers • magazines • cv/resume • website design • advertising/marketing on- and offline • flyers • e-mails • corporate brochures • etc. Preview and download here.
Modern Infographic Paper Template
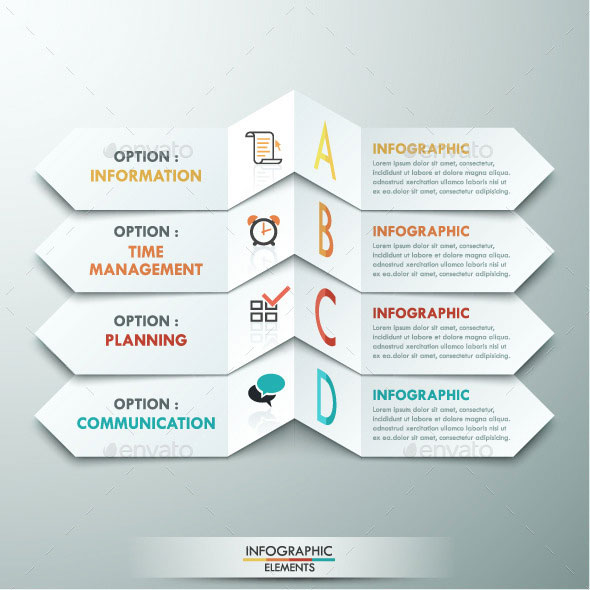
Modern infographics options template with 4 white paper sheets. Vector. Can be used for web design and workflow layout. Preview and download here.
MegaPack Infographic Set
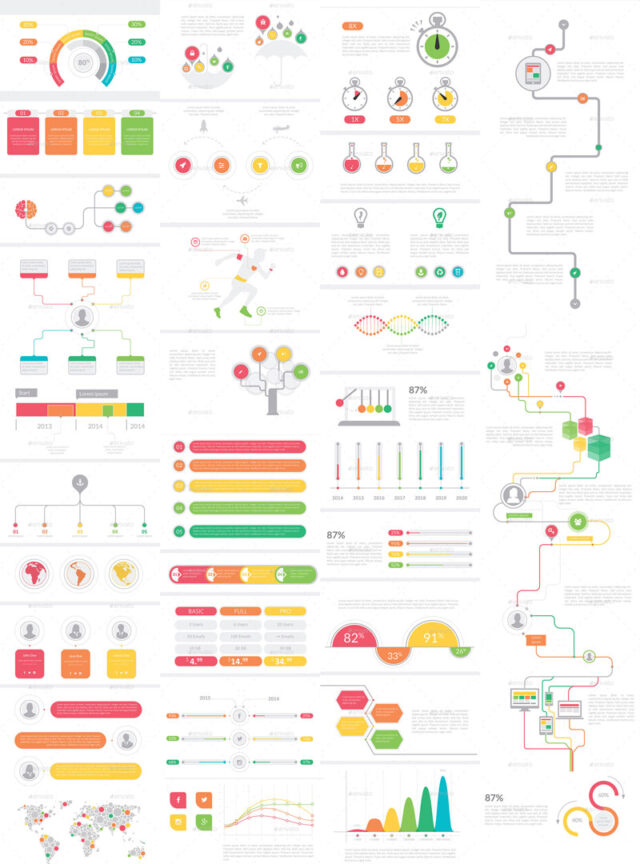
You will not go wrong with this mega-pack. This huge set contains a handful of different infographic templates for any purpose. Preview and Download here.
Shopping Infographic
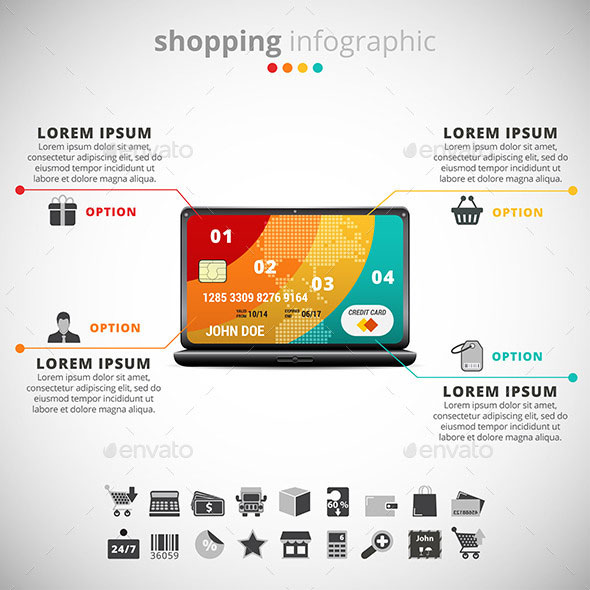
Vector illustration of school infographic made of notebook and credit card. 22 icons inside file. Preview and Download here.
Business Infographics Elements
Business infographics elements for corporate brochures. Collection of modern infographic elements in a flyer and brochure concept. Flat design. Vector. Fully editable vector based Infographic elements, ready to use for your project, print, banner, web, presentation, etc. Preview and Download here.
Evolution Infographic Set
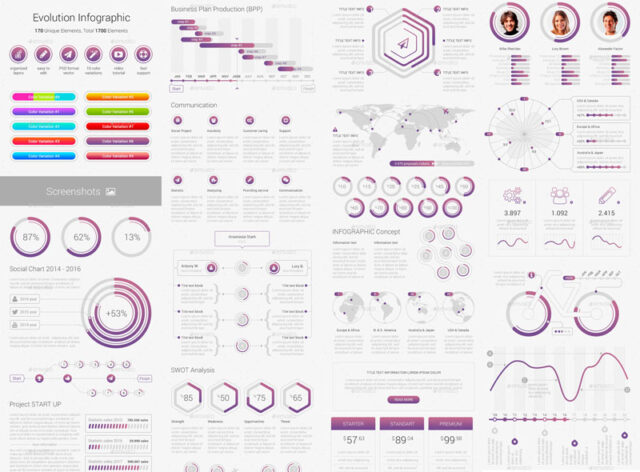
Another excellent set full of variety of infographic elements. Set is a multipurpose and covers various areas of business, education, marketing and the like. Preview and Download here.
