We are bombarded with boring texts unimaginative instructions, lengthy researches, too long analyzes. In business for such problems most helpful is – Infographic.
What is the Infographic?
Infographic is a communication tool most often in the form of images, which are created primarily for the web environment and the interesting design that illustrates the words, numbers, and all other relevant information on a topic. It exists almost since man; people were comunicating through the pictures long ago in the caves, there are cuneiform and hieroglyphics, then murals throughout the Middle Ages, and so on…
If a picture speaks a thousand words, Infographic speaks a thousand and one.
What you can “tell” by Infographic
Infographic can be used:
- When introducing new products or when comparing with similar products
- For a comparative analysis of data and statistics
- To illustrate the instructions for use, in products / services
- In the form of a modern Press Releases
- And much more…
How to make Infographic in 5 steps / phases
1. Answer the question: what do I want to achieve?
First of all, as well as using any other tool, ask yourself what you want to achieve. Do you want explain something, to promote, to remind people of the important points of your distinctive brand / services, help in resolving the crisis, to illustrate the growth of your businesses, the impact of management, political program …
The result of this first stage should be a defined goal of infographic in one sentence!
2. Analysis, research and data collection
Once you know what you want to achieve, it’s time for the data retrieval, analysis and information that will be of use. It is a process of analysis and research.
Within this process it is important that you are:
- analytical type of person
- inclined to lateral / creative thinking
- know enough about the topic or know where to find what you do not know necessarily distinguishing the important from the unimportant!
The result of the second phase would have to be thick drawer / folder with links, documents, analyzes, descriptions … that relate to the topic of infographic.
3. Deduction
The third phase includes brain in 6th speed! And both hemispheres. Combine data and information with creative and inspirational elements of your spirit that you can from general conclusions come down to the individual – significant and comparable, all to achieve the main target of infographic!
The result of the third phase is the mapping of most important group of information, visually placed on a sheet of paper.
4. Data Visualization
Here you come up with the visual structure of infographic. Where and in what form you will set data selected through a phase of deduction. Will the data be illustrated by pie charts, through the funnel, in the rating stars; will the main illustration which contain data or information will be separated from the central illustration; what’s the best example of illustration for growth: the step, the arrow, the mountain, etc.
The result of the fourth phase is a clear concept of the structure and partially clear vision of the expected design.
5. Infographic design
Now you have all the answers and you’re ready for concise conversation with your designer. You will tell him what you want to achieve, what data you intend to achieve, how you see it visually, the extent to which you want to implement your own (already existing) visual identity etc..
Be open to ideas from the other side. No matter how much thought you are creative and have an eye for visual things, experts have it more – more ideas, more solutions, better eye, sense of color, symmetry.
The result of the last, the fifth phase is clear, interesting and visually appealing, not to mention beautiful infographic that people will simply want to share with theirr friends!
General recommendations for infographic:
- It must have a clear business and promotional objectives
- It must be clear and simple
- It must be interesting
- It must be easily “sharable”
- Mention reference to the source and the maker of the infographic in lower part (footer) of infographic
Do not forget – making good infographic is not an easy job! Infographics are the essence of your intellectual and creative potential on a theme. Prepare it the best you can and the results will be suprising.
Below you can see best data visualization infographic templates for download:
Ground Transport Infographics
Ground transport travel infographic set with car truck bike minivan vector illustration. Editable EPS and Render in JPG format. Download here.
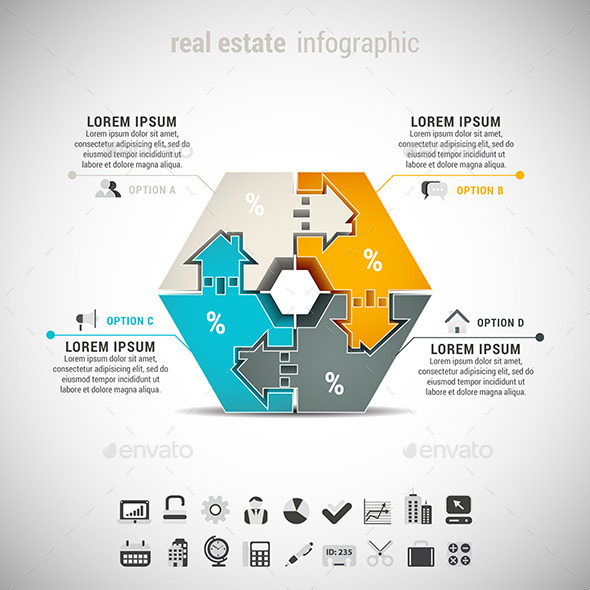
Real Estate Infographic
Vector illustration of real estate infographic. 22 icons inside file. ZIP includes free font link, EPS10 and high resolution JPEG files. Download here.
Business Arrow Step Staircase Infographics
Business arrow step staircase infographics. Can be used for workflow layout, banner, diagram, web design. The ZIP files include : – EPS 10 compatible vector files, – Adobe illustrator AI CS with live editable text, – HQ 300dpi JPEG image files – HQ 300dpi PSD image files – HQ 300dpi TIFF image files. Download here.
![]()
Business Handshake Infographics
Business handshake infographics. Can be used for workflow layout, banner, diagram, web design. The ZIP files include : – EPS 10 compatible vector files, – Adobe illustrator AI CS with live editable text, – HQ 300dpi JPEG image files – HQ 300dpi PSD image files – HQ 300dpi TIFF image files. Download here.

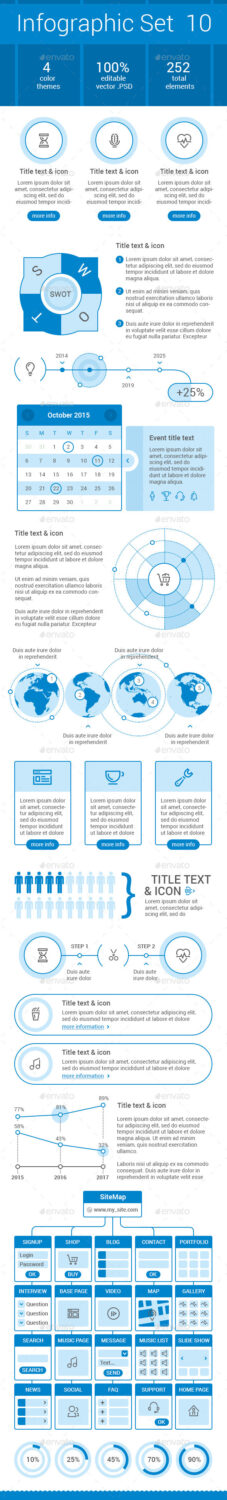
Infographic SET 10
All elements in 100% .PSD VECTOR. Download here.
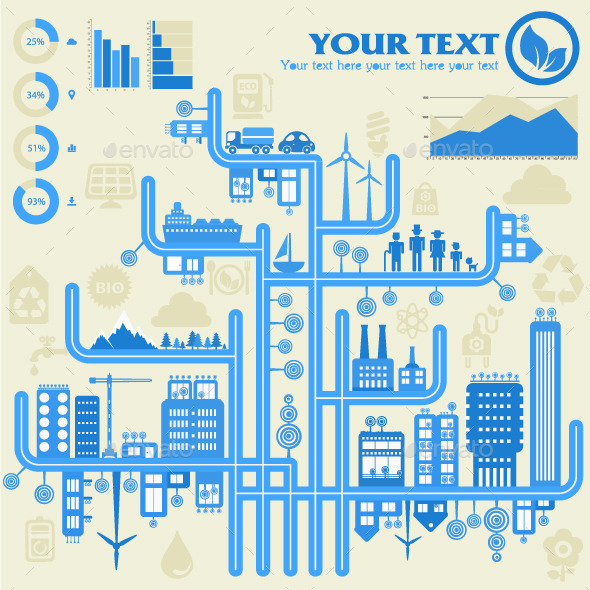
Eco City Infographics
High detailed conceptual illustration of flat style ecological infographics template, which can be used for articles, reports and presentaitions about big cities ecological situation. Vector file is fully editable separately groupped and layered EPS 10 version file. Preview Image Set contains three big size 1920×1920 color variations in JPG files – green, blue from the vector version and one more on blurred polygonal modern background. Download here.
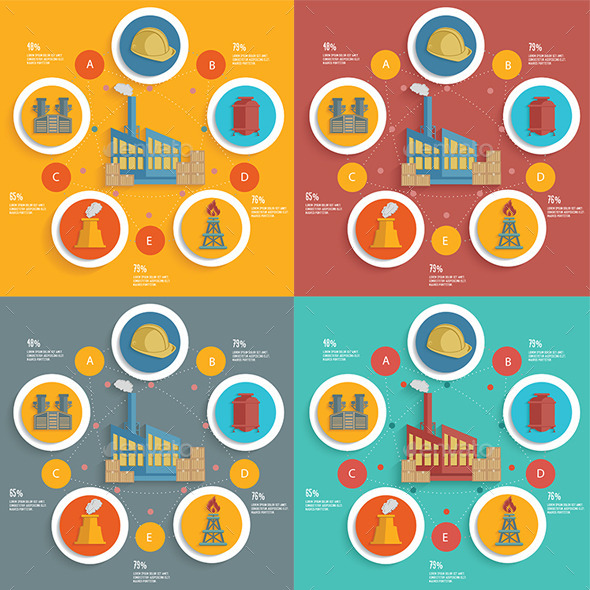
Industry Design
Files Include: . AI, – 2 AI Files for Illustrator CS and Illustrator 10; . EPS – 2 EPS Files for Illustrator CS and Illustrator 10; . JPG File. Download here.
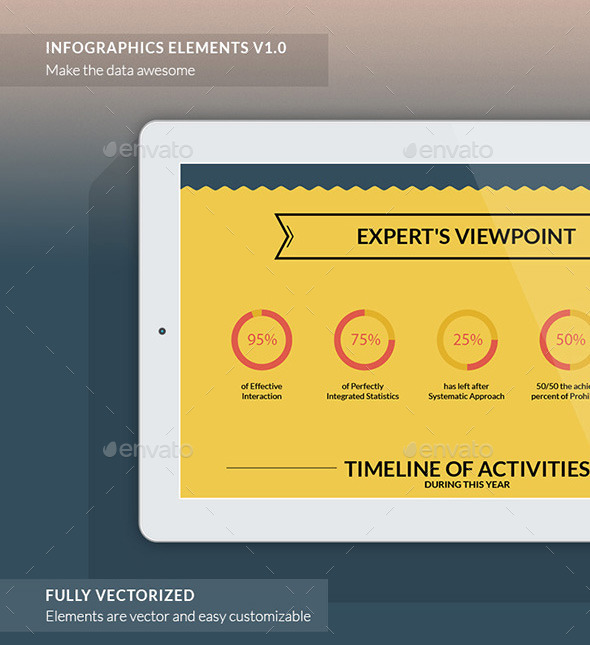
Multi-Purpose Set of Infographics Elements v1.0
Easy-customizable set of Infographics Elements. First of all it can be useful for graphic designers who want to save their time and create the well structured infographics using the easy-customizable elements. There are many ways of usage: – Making of infographics for different needs (e.g. ecological statistics, some internet stats etc) – Data visualization of business processes – Creating visual reports. Download here.
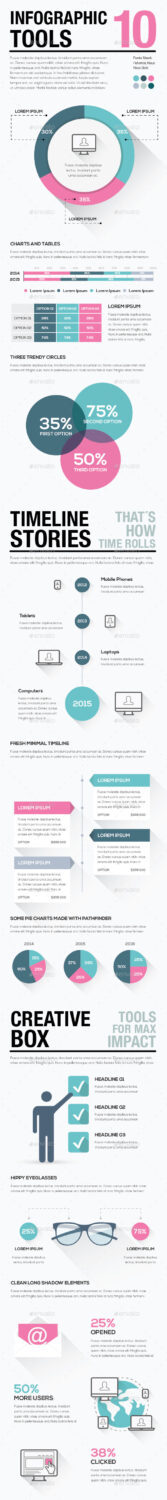
Infographic Tools 10
Vector elements to create and inspire your infographics! Works best with Adobe Illustrator CS6. All elements seen on preview included in download. Fully editable vector file saved as EPS10, CS EPS and AI CS6, objects contains transparencies. Rescale to any size. Download here.
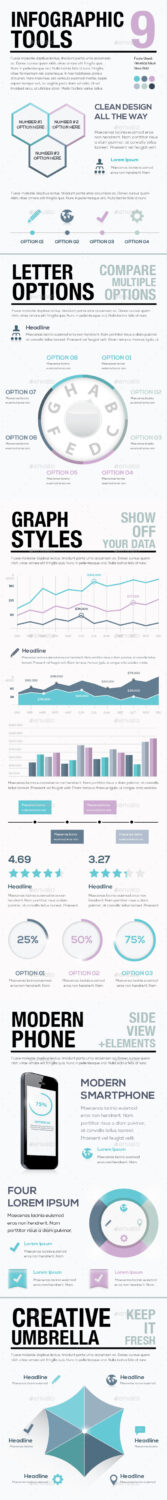
Infographic Tools 9
Some creative vector elements for you to create infographics easy and fast! Works best with Adobe Illustrator CS6. All elements seen on preview included in download. Fully editable vector file saved as EPS10, CS EPS and AI CS6, objects contains transparencies. Rescale to any size. Download here.