
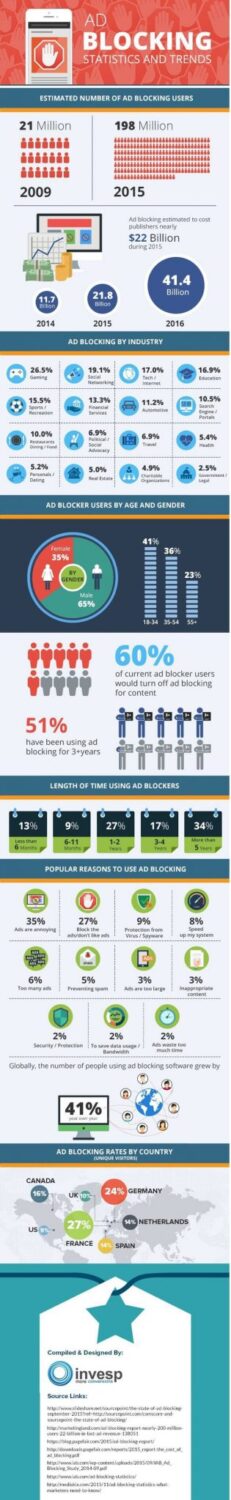
Ads can be very annoying, we all know that, especially on mobile devices and internet browsers. Ad blocking in web browsers is gradually growing. The use of any of the additives for ad blocking is globally increased from about 21 million users in 2009 to 198 million active users by June 2015. Ad blocking in web browsers for their devices using AdBlock Plus function was first announced Asus. Then the Samsung has joined. Ad blocking feature in Samsung’s browser-based operating system Android will arrive via OTA updates.
Obviously more “surfers” are annoyed by ads on the website especially if they are aggressive and interfere reading and finding the desired content. This is especially a problem for those who surf on the Internet using a mobile phone on smaller screens. Some block the ads in order to protect from viruses / spyware or preventing SPAM. And this is also an acceptable reason.
It is estimated that the advertisers have lost almost $ 22 billion during 2015, thanks to the programs of ad blocking and that this year, this amount could rise to $ 41.4 billion. The ads that are the most blocked are the one in the gaming industry, even 26.5%. In the infographic below by Invesp Consulting you can find more interesting statistics and the latest trends in blocking ads, check it out:


")


