
Infographics and data visualizations have become common on the web portals, blogs, in magazines and the stores because they represent a way to reveal information hidden in the layers of data. With visual representations of data we successfully upgrade communications strategy, marketing and sales approach.
Infographics allow us to form data in understandable information that users can internalize in the form of knowledge.
In order to prepare an effective infographics you must first be familiar with the process and the 8 steps that are necessary to create it:
1. GOAL
First we have to decide what is the goal of your infographic, and that is the topic that you want to convey to your target group of users or readers.
2. RESEARCH
When you have defined goal in your mind, the next step is investigating what data exist on the Internet, which information is related to the selected topic, and which you have available within the company (Google Analytics, BI, DFP, internal database, Sales Force, Mailchimp …).
3. ANALYSIS
Now you should highlight the essence data from the collected one in previous phase. This is most easily achieved by forming a term that encompasses and summarizes the main results of the analysis. At this stage, often it turns out that you’ll probably need more research and data to substantiate results.
4. CONTENT, SKETCH AND PROTOTYPE
For more complex data visualization, you can, in a number of examples, use the principles arising from the establishment of the user experience from the mapping information architecture to sketch the user time and skeletal models (wireframes). For simple graphs on the other hand is sufficient record of the main findings and a short description of the data analysis. It is advisable to test the prepared drawings and analysis with colleagues paying particular attentionto the clarity and comprehensibility of data.
5. VISUALIZATION AND CONTENT
Figures and content translated into a visual language where you show links, hierarchy, relationship, importance and necessity. To display this information, use colors, sizes, fonts, icons and pictograms, possibly photos, video or animation. Visualization, except content largely reflects the visual identity of the company or organization, so it is important to use the color scheme of the company. In the infographics are particularly important readability and user-friendliness.
6. VISUALIZATION AND COMMUNICATION CHANNELS
Mode of visualization is closely related to the content, communication strategy and selecting media companies. If you already prepared content and know the communication strategy, you only have to choose the media. Choose the one that is most appropriate to your target group (article on your own online site, an article on another online site, Linekdin, Facebook, Twitter, SlideShare, publication in print media, …). The channel, in making infographics, often determines the format, the ability to use animation and interactivity, and often the color scale and the use of letters.
7. VISUALIZATION AND TOOLS
In the final step for the selected media prepare the final visual appearance of the data. For static infographics you can use Adobe Illustrator, while for visualization of animated and interactive infographics there are easy solutions online, such as: https://infogr.am or advanced like https://d3js.org/ and https://processing.org/.
8. PUBLISHING AND MEASURING SUCCESS
You must not forget the performance measurement, you can measure the time and resources that you have invested in the making. Based on the measurements, in the next infographic you can upgrade process, content and visual appearance.

Every day, infographics are becoming more common form of communication because they show numbers or a larger amount of data in a very clear and interesting way. Effective visualization primarily gives a look at the data, not just the beautiful visual elements. If you want to find out more about creating infographics, visit our previous article with all tutorials that you need.
Also to help you in creating your own infographic, we prepared some fresh new popular elements for download. All elements are ready to use, easy to manage with and editable. Check out below and Good Luck in creating it!
Simple Infographic Elements
Big Infographics Design
Business – Start Up Infographics Design
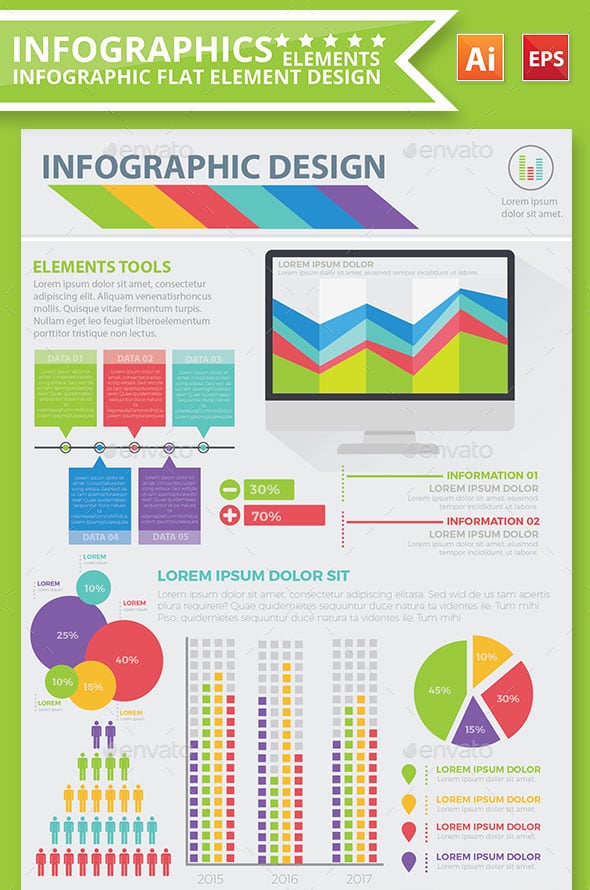
Infographic flat elements design
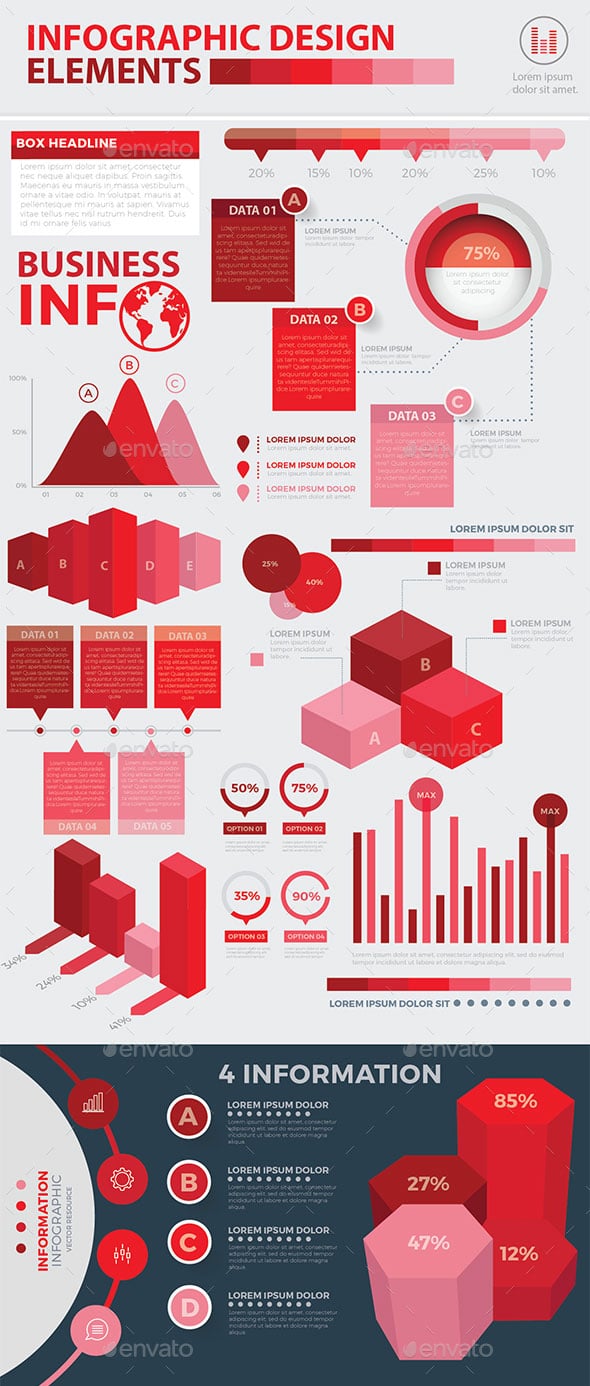
Infographic elements design
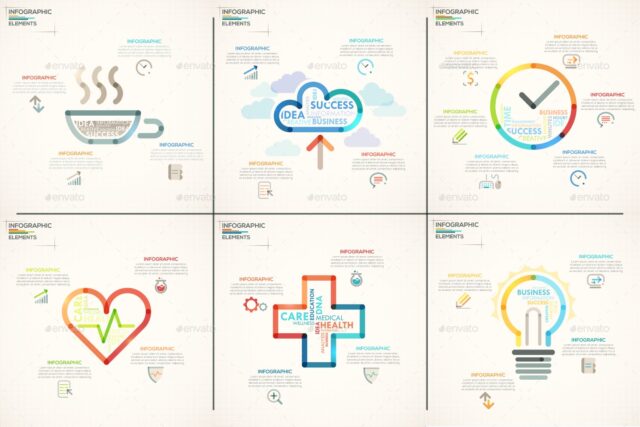
Modern Infographic elements design
Outline Infographic Bundle
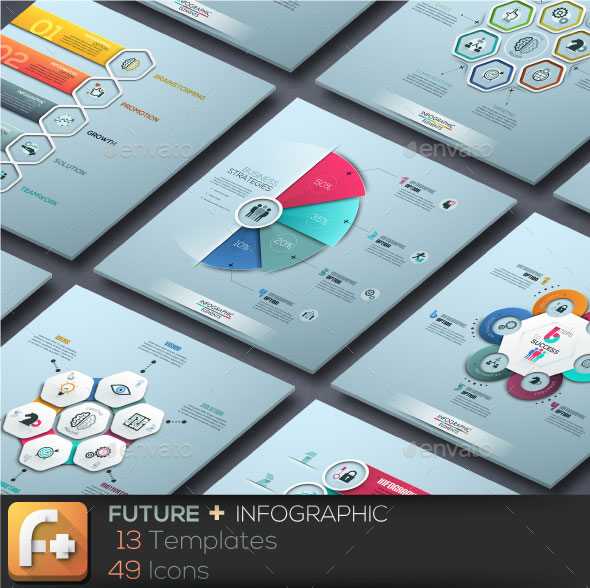
”Future + ” Infographics
Paper – Pro Infographic


")


