Until recently, infographics have been a really good way to attract the attention of many people and to get traffic to your blog or a website. Today, it is no longer the case, but if you make interesting infographic with unique design and attractive data, this method can still function. But, how to make not good, yet excellent infographic? We present you five tips for better infographic design.
1.Target specific audience
Infographics are not meant for wider masses. Infographic usually has a narrow target audience, but no matter what, number of people whom you are target can be numerous. Good idea for infographic is not sufficient enough, it is necessary to collect very interesting, precise and up-to-date information that target audience want to find out. So, first you need to find out what the target audience wants to know about a particular area, and then you must try to be creative and original. If it comes to technology, it is not good idea to collect data that most people already know. It is necessary to dig a little deeper, to find out something new, something revolutionary and even controversial. Once you find out this information, infographic can be submitted where fans of the highest technology can search for it.
2.Be simple but precise
Infographics must not confuse users and make their brains work too much. Too much information can lead to adverse effects, and in the end users will not be able to remember what it is infographic about in the first place. Infographic must not contain more than four or a maximum of five points that will summarize all information needed and presented to the target group. Anything more than that is just
the accumulation of unnecessary data.
3.Determine data hierarchy
If you want quality infographic design, it is necessary to do hierarchy of data. This means that data must be classified by certain structure, and not just randomly piled everywhere. If you want to present financial data, they must not must not interfere with alphanumeric data. Also, important information should be displayed in larger numbers, letters and symbols because it gets noticed first by the users, and only after thhat, you can branch less important data into smaller portions.
4.Use visual power
Infographic is based on graphical data, not the words. People are interested in learning about specific figures, a visual representation of data with few words. Brain perceives number and numerical data much faster than complex sentences, which first needs to process, and then to analyzes. Also, do not use outdated data which are not accurate. Check your sources several times before you use thouse sources and put data into an infographic.
5.Don’t be creative, be VERY creative
Everybody can create infograhics, right? Wrong. Creating infograhics can be hard and long lasting. If you are not a good designer, the idea may be completely useless if you do not know how to present that idea. You must transform idea into action. Genuine designer of infographics already knows in advance what will his or hers infographics look like, good designer has a vision and knows exactly how many points will infographic has, and what graphic style will be displayed. Creativity is what drives us, and originality is what stands out among other people. If you have the creativity and originality, you are on a half way to create quality infographic.
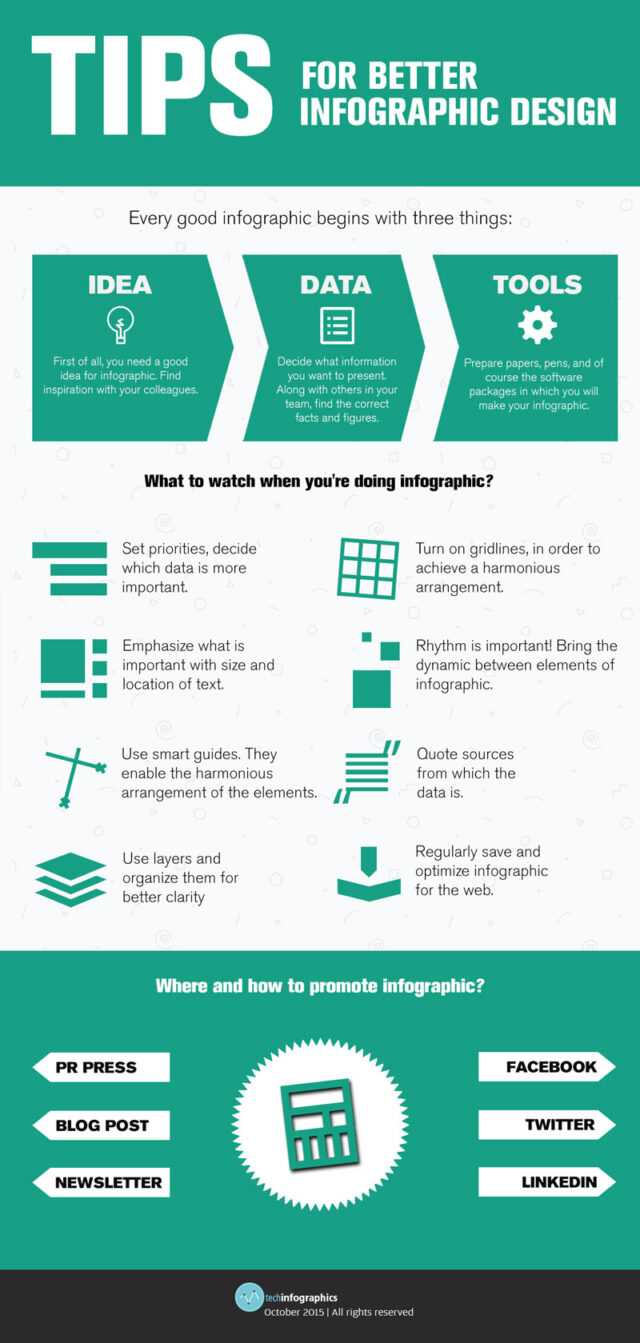
Infographic is a great way to share you message with large number of people. People are visual learners and this is not just a simple fact. Before you create infographic, determine its purpose, do a plan and research, make design, check data you collected, and share your infographic with others only if you are one hundred percent sure you created something stunning and trust-worthy. Below you can check infographic with tips for better infographic design: